Sacramento, CA — CAL Fire has updated the state’s Fire Hazard Severity maps detailing the areas most fire-prone.
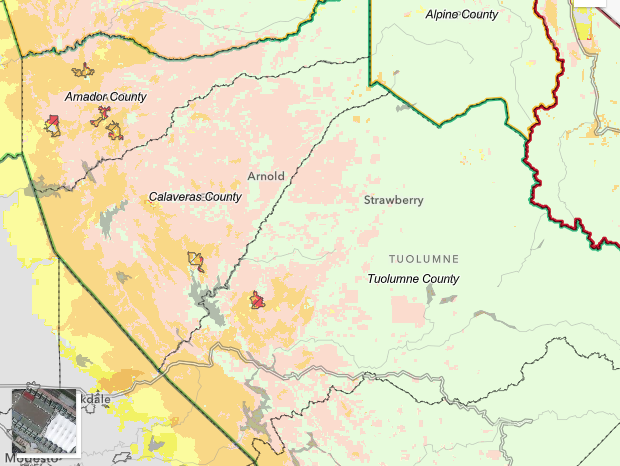
The last update was in 2011 and the regions deemed “high” or “very high” shown in orange and red increased 168% since that time, and now impact about 3.7 million people. Most of the Mother Lode region is included.
CAL Fire has been releasing the results of the various areas of the state over recent weeks, with the fourth and final installment yesterday. Being in a high or very high area has state legal impacts in relation to real estate disclosure requirements, defensible space rules, and state building code rules.
Click here (and scroll down) to find a map where you can put in your address to find the specific fire severity.
Some common questions and answers provided by CAL Fire are below:
What is a “Fire Hazard Severity Zone,” or FHSZ?
Answer: Public Resource Code 4202; The State Fire Marshal shall classify lands within state responsibility areas into fire hazard severity zones. Each zone shall embrace relatively homogeneous lands and shall be based on fuel loading, slope, fire weather, and other relevant factors present, including areas where winds have been identified by the department as a major cause of wildfire spread. Government Code 51178; The State Fire Marshal shall identify areas in the state as moderate, high, and very high fire hazard severity zones based on consistent statewide criteria and based on the severity of fire hazard that is expected to prevail in those areas. Moderate, high, and very high fire hazard severity zones shall be based on fuel loading, slope, fire weather, and other relevant factors including areas where winds have been identified by the Office of the State Fire Marshal as a major cause of wildfire spread.
Why are fire hazard severity maps being updated?
Answer: The hazard maps are being updated to more accurately reflect the zones in California that are susceptible to wildfire. The hazard mapping process will incorporate new science in local climate data and improved fire assessment modeling in determining hazard ratings.
What do Fire Hazard Severity Zones measure?
Answer: The Fire Hazard Severity Zone map evaluates “hazard,” not “risk”. The map is like flood zone maps, where lands are described in terms of the probability level of a particular area being inundated by floodwaters, and not specifically prescriptive of impacts. “Hazard” is based on the physical conditions that create a likelihood and expected fire behavior over a 30 to 50-year period without considering mitigation measures such as home hardening, recent wildfire, or fuel reduction efforts. “Risk” is the potential damage a fire can do to the area under existing conditions, accounting for any modifications such as fuel reduction projects, defensible space, and ignition resistant building construction.
Where do Fire Hazard Severity Zones apply?
Answer: Fire Hazard Severity Zones are found in areas where the state has financial responsibility for wildfire protection and prevention, called the State Responsibility Area. More than 31 million acres are in this area. Under Senate Bill 63 (Stern, 2021) Government Code 51178 was amended to add the Moderate and High Fire Hazard Severity Zones with the Very High in local jurisdictions.
What are the uses of Fire Hazard Severity Zones?
Answer: The zones are used for several purposes including to designate areas where California’s defensible space standards and wildland urban interface building codes are required. They can be a factor in real estate disclosure, and local governments may consider them in their general plan.
What are the key elements of the Fire Hazard Severity Zone model?
Answer: The fire hazard severity model for wildland fire has two key elements: probability of an area burning and expected fire behavior under extreme fuel and weather conditions. The zones reflect areas that have similar burn probabilities and fire behavior characteristics. The factors considered in determining fire hazard within wildland areas are fire history, flame length, terrain, local weather, and potential fuel over a 50-year period. Outside of wildlands, the model considers factors that might lead to buildings being threatened, including terrain, weather, urban vegetation cover, blowing embers, proximity to wildland, fire history, and fire hazard in nearby wildlands. FHSZs are not a structure loss model, as key information regarding structure ignition (such as roof type, etc.) is not included.
How do the Fire Hazard Severity Zone Maps differ from California Public Utilities Commission (CPUC) High Fire Threat District Maps?
Answer: The California Public Utilities Commission (CPUC) sponsored map, known as “CPUC High Fire Threat District Map” (HFTD), includes similar factors as those in the FHSZ maps, however the CPUC HFTD Map is designed specifically for identifying areas where there is an increased risk for utility associated wildfires. As such, the CPUC map includes fire hazards associated with historical powerline-caused wildfires, current fuel conditions, and scores areas based on where fires start, as opposed to where potential fires may cause impacts.
Why is my property in a different zone than the adjacent area, which looks similar?
Answer: In non-wildland areas, zone edges occur based on distance to the wildland edge. Because hazard in these areas is largely determined by incoming embers from adjacent wildland, urban areas that are similar in vegetation type and housing density may have a change in FHSZ class as the distance to the wildland edge increases. Areas immediately adjacent to wildland receive the same FHSZ score as that wildland where fire originates, and the model then produces lower scores as the distance to wildland edge increases. In wildland areas, zone edges are a result of the way zones are delineated. Specifically, zones represent areas of similar slope and fuel potential. Zone boundaries divide zones based on geographic and vegetation features that align with fire hazard potential; although, at a local scale, it may appear that the immediate area is similar on both sides of the edge. The class value within a zone is based on the average hazard score across the whole zone, so areas that are in the same zone but not immediately adjacent to a local area can have an influence on the final zone classification.